
Page 63 - Math Course 1 (Book 2)
P. 63
Linear Relationships
Mo. 8
Lesson 7
Hours 1 2 3 4
Miles 50 100 150 250
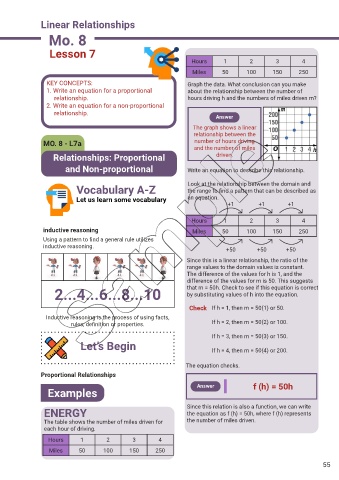
KEY CONCEPTS: Graph the data. What conclusion can you make
1. Write an equation for a proportional about the relationship between the number of
relationship. hours driving h and the numbers of miles driven m?
2. Write an equation for a non-proportional
relationship.
Answer
The graph shows a linear
relationship between the
MO. 8 - L7a number of hours driving
and the number of miles
Relationships: Proportional driven.
and Non-proportional Write an equation to describe this relationship.
Vocabulary A-Z Look at the relationship between the domain and
the range to f nd a pattern that can be described as
Let us learn some vocabulary an equation.
+1 +1 +1
Hours 1 2 3 4
inductive reasoning Miles 50 100 150 250
Using a pattern to f nd a general rule utilizes
inductive reasoning.
+50 +50 +50
Since this is a linear relationship, the ratio of the
range values to the domain values is constant.
The difference of the values for h is 1, and the
difference of the values for m is 50. This suggests
2...4...6...8...10 that m = 50h. Check to see if this equation is correct
by substituting values of h into the equation.
Check If h = 1, then m = 50(1) or 50.
Inductive reasoning is the process of using facts,
rules, def nition or properties. If h = 2, then m = 50(2) or 100.
If h = 3, then m = 50(3) or 150.
Let’s Begin If h = 4, then m = 50(4) or 200.
The equation checks.
Proportional Relationships
Answer f (h) = 50h
Examples
Since this relation is also a function, we can write
ENERGY the equation as f (h) = 50h, where f (h) represents
The table shows the number of miles driven for the number of miles driven.
each hour of driving.
Hours 1 2 3 4
Miles 50 100 150 250
55