
Page 93 - Math Course 3 (Book 1)
P. 93
Rate of Change and Direct Variation
Mo. 3
Lesson 4 y y
KEY CONCEPTS: 0 x 0 x
1. Identify proportional and non-proportional
relationships by finding a constant rate of
change.
2. Solve problems involving direct variation. Concept Summary
Proportional Linear Relationship
Words Two quantities a and b have a proportional
MO. 3 - L4a linear relationship if they have a constant
ratio and a constant rate of change.
Identify Proportional and
Nonproportional Relationships Graph Symbols
b a is constant and
b
Vocabulary A-Z change in b
Let us learn some vocabulary 0 a change in a is constant
Linear Relationship Let’s Begin
Relationships that have straight-line graphs are
called linear relationships.
Use a Graph to Find a Constant Rate of Change
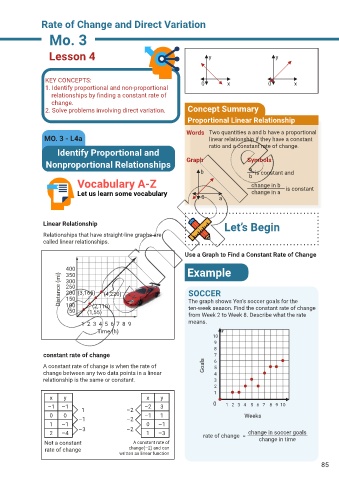
400 Example
350
Distance (mi) 300 (4,220) SOCCER
250
200 (3,165)
150
100
(2,110)
ten-week season. Find the constant rate of change
50 (1,55) The graph shows Yen’s soccer goals for the
from Week 2 to Week 8. Describe what the rate
1 2 3 4 5 6 7 8 9 means.
Time (h)
10
9
8
constant rate of change 7
A constant rate of change is when the rate of Goals 6
5
change between any two data points in a linear 4
relationship is the same or constant. 3
2
1
x y x y
–1 –1 1 –2 –2 3 0 1 2 3 4 5 6 7 8 9 10
0 0 –1 –2 –1 1 Weeks
1 –1 0 –1
2 –4 –3 –2 1 –3 rate of change = change in soccer goals
Not a constant A constant rate of change in time
rate of change change(–2) and can
written as linear function
85