
Page 32 - Science Course 1 (Book 1)
P. 32
Mo. 1 - L3b What are Qualitative and Quantitative Data?
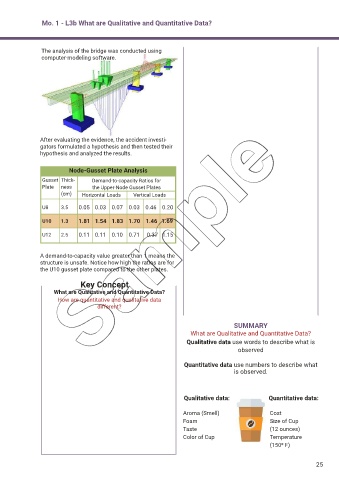
The analysis of the bridge was conducted using
computer-modeling software.
After evaluating the evidence, the accident investi-
gators formulated a hypothesis and then tested their
hypothesis and analyzed the results.
Node-Gusset Plate Analysis
Gusset Thick- Demand-to-capacity Ratios for
Plate ness the Upper-Node Gusset Plates
(cm) Horizontal Loads Vertical Loads
U8 3.5 0.05 0.03 0.07 0.03 0.46 0.20
U10 1.3 1.81 1.54 1.83 1.70 1.46 1.69
U12 2.5 0.11 0.11 0.10 0.71 0.37 1.15
A demand-to-capacity value greater than 1 means the
structure is unsafe. Notice how high the ratios are for
the U10 gusset plate compared to the other plates.
Key Concept
What are Qualitative and Quantitative Data?
How are quantitative and qualitative data
different?
SUMMARY
What are Qualitative and Quantitative Data?
Qualitative data use words to describe what is
observed
Quantitative data use numbers to describe what
is observed.
Qualitative data: Quantitative data:
Aroma (Smell) Cost
Foam Size of Cup
Taste (12 ounces)
Color of Cup Temperature
(1500 F)
25