Page 69 - Math Course 3 (Book 1)
P. 69

Exponential Functions


                Your Turn!


                Use Exponential Functions to Solve Problems

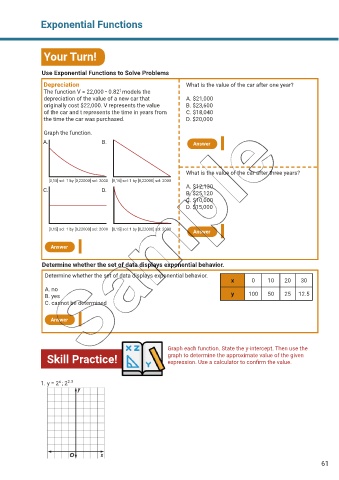
                Depreciation                                      What is the value of the car after one year?
                                           t
                The function V = 22,000 • 0.82  models the
                depreciation of the value of a new car that       A. $21,000
                originally cost $22,000. V represents the value   B. $23,600
                of the car and t represents the time in years from   C. $18,040
                the time the car was purchased.                   D. $20,000

                Graph the function.
                A.                   B.                              Answer


                                                                  What is the value of the car after three years?
                  [0,15] scl: 1 by [0,22000] scl: 2000 [0,15] scl: 1 by [0,22000] scl: 2000
                                                                  A. $12,130
                C.                   D.                           B. $25,120
                                                                  C. $10,000
                                                                  D. $15,000


                  [0,15] scl: 1 by [0,22000] scl: 2000 [0,15] scl: 1 by [0,22000] scl: 2000
                                                                     Answer
                   Answer


                Determine whether the set of data displays exponential behavior.

                 Determine whether the set of data displays exponential behavior.
                                                                                  x      0     10    20    30
                 A. no
                 B. yes                                                           y     100    50    25   12.5
                 C. cannot be determined

                   Answer


                                                            Graph each function. State the y-intercept. Then use the
                  Skill Practice!                           graph to determine the approximate value of the given
                                                            expression. Use a calculator to confirm the value.


                      x
               1. y = 2 ; 2 2.3


                                                                                                                  61
   64   65   66   67   68   69   70   71   72   73   74