
Page 51 - Math Course 1 (Book 1)
P. 51
Algebraic Functions and Relations
Key Concept Graph the data.
The values of the x-axis need to go from 1996 to
2005.
Inverse of a Relation • It is not practical to begin the scale at 0.
Begin at 1996 and extend to 2005 to include all
Relation Q is the inverse of relation S if and only of the data.
if for every ordered pair (a, b) in S, there is an • The units can be 1.5 units per grid square.
ordered pair (b, a) in Q.
The values on the y-axis need to go from 21 to
60.
Inverse of • In this case it is possible to begin the scale at 0.
Relation Begin at 0 and extend to 70.
Relation • You can use units of 10.
{(0, 2), (-5, 4)} {(2, 0), (4, -5)}
Percent Satisf ed with Grades
70
60
Percent Satisf ed 30
Let’s Begin 50
40
10
Use a Relation 20
0
1996 1999 2002 2005
Year
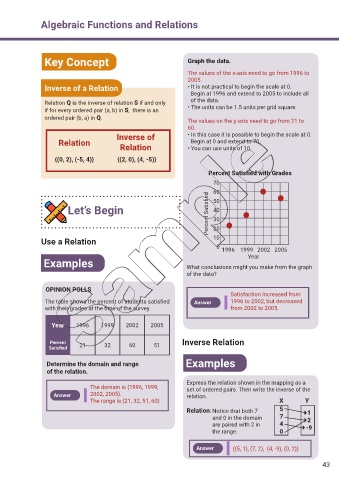
Examples What conclusions might you make from the graph
of the data?
OPINION POLLS
Satisfaction Increased from
The table shows the percent of students satisf ed Answer 1996 to 2002, but decreased
with their grades at the time of the survey. from 2002 to 2005.
Year 1996 1999 2002 2005
Percent 21 32 60 51 Inverse Relation
Satisf ed
Determine the domain and range Examples
of the relation.
Express the relation shown in the mapping as a
The domain is {1996, 1999, set of ordered pairs. Then write the inverse of the
Answer 2002, 2005}. relation.
The range is {21, 32, 51, 60} X Y
Relation: Notice that both 7 5 1
and 0 in the domain 7 2
are paired with 2 in 4 -9
the range. 0
Answer {(5, 1), (7, 2), (4, -9), (0, 2)}
43