Page 52 - Math Course 1 (Book 1)
P. 52

Algebraic Functions and Relations


         Inverse: Each X and Y in each ordered pair to         B.
                  write the inverse relation.
                                                                     05
                                                                     98
             Answer       {(1, 5), (2, 7),  (-9, 4), (2, 0)}         94

                                                                     90
                                                                     86

         Your Turn!                                                   0      500   1000  1500  2000  2500


         Use a Relation                                        C.  2500
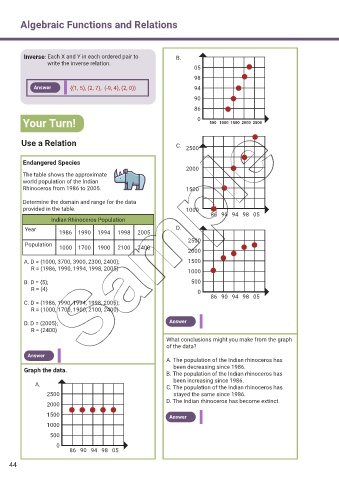


         Endangered Species
                                                                  2000
         The table shows the approximate
         world population of the Indian
         Rhinoceros from 1986 to 2005.                            1500


         Determine the domain and range for the data
         provided in the table.                                   1000
                                                                              86   90   94   98   05
                   Indian Rhinoceros Population

          Year                                                 D.
                      1986  1990   1994   1998   2005
                                                                   2500
          Population
                      1000  1700   1900   2100   2400
                                                                   2000
         A. D = {1000, 3700, 3900, 2300, 2400};                    1500
              R = {1986, 1990, 1994, 1998, 2005}
                                                                   1000
         B. D = {5};                                                500
              R = {4}
                                                                      0
                                                                              86   90   94   98   05
         C. D = {1986, 1990, 1994, 1998, 2005};
              R = {1000, 1700, 1900, 2100, 2400}

         D. D = {2005};                                     Answer
              R = {2400}
                                                           What conclusions might you make from the graph
                                                           of the data?
           Answer
                                                           A. The population of the Indian rhinoceros has
                                                                been decreasing since 1986.
         Graph the data.
                                                           B. The population of the Indian rhinoceros has
                                                                been increasing since 1986.
             A.                                            C. The population of the Indian rhinoceros has
                 2500                                           stayed the same since 1986.
                                                           D. The Indian rhinoceros has become extinct.
                 2000
                 1500                                       Answer
                 1000

                   500
                     0
                            86   90   94   98   05

    44
   47   48   49   50   51   52   53   54   55   56   57