
Page 29 - Math Course 3 (Book 1)
P. 29
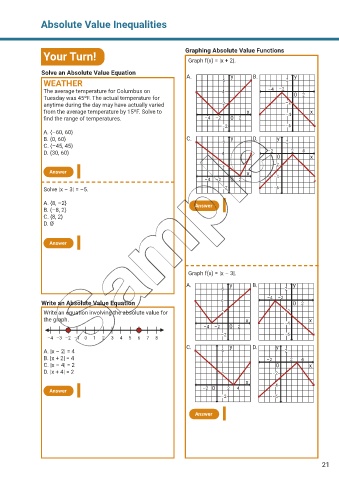
Absolute Value Inequalities


                Your Turn!                                        Graphing Absolute Value Functions
                                                                   Graph f(x) = |x + 2|.

                Solve an Absolute Value Equation
                                                                   A.          6  y       B.         2  y
                WEATHER
                The average temperature for Columbus on                        4               –4  –2   0  2
                Tuesday was 45ºF. The actual temperature for
                anytime during the day may have actually varied                2                     –2
                from the average temperature by 15ºF. Solve to                          x            –4       x
                find the range of temperatures.                          –4  –2   0  2
                                                                               –2                    –6
                A. {–60, 60}
                B. {0, 60}                                         C.          6  y       D.      y  2
                C. {–45, 45}
                D. {30, 60}                                                    4               –2      2   4
                                                                                                  0           x
                                                                               2                 –2
                  Answer                                                                x
                                                                         –4  –2   0  2           –4
                Solve |x – 3| = –5.                                            –2                –6

                A. {8, –2}                                            Answer
                B. {–8, 2}
                C. {8, 2}
                D. Ø


                  Answer


                                                                   Graph f(x) = |x – 3|.

                                                                  A.              y       B.            y
                                                                               6                     2
                                                                                               –4  –2
                Write an Absolute Value Equation                               4                        0  2
                Write an equation involving the absolute value for             2                     –2
                the graph.                                                             x             –4       x
                                                                         –4  –2   0  2
                                                                               –2                    –6
                  –4 –3  –2 –1  0  1  2  3  4  5  6  7  8
                                                                  C.              y       D.      y
                A. |x – 2| = 4                                                 6                     2
                B. |x + 2| = 4                                                 4               –2      2   4
                C. |x – 4| = 2                                                                    0           x
                D. |x + 4| = 2                                                 2                 –2
                                                                                       x         –4
                  Answer                                                –2  0    2  4
                                                                               –2                –6


                                                                      Answer


                                                                                                                  21