
Page 39 - Math Course 3 (Book 1)
P. 39
Graphing Systems of Inequalities
Mo. 1
Lesson 8 Let’s Begin
KEY CONCEPTS:
1. Solve systems of inequalities by graphing. Solve By Graphing
2. Solve real-world problems involving systems
of inequalities. Examples
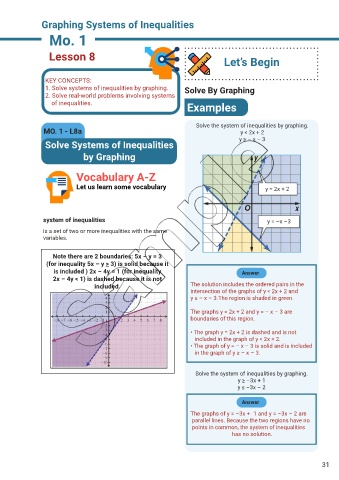
Solve the system of inequalities by graphing.
MO. 1 - L8a y < 2x + 2
Solve Systems of Inequalities y ≥ – x – 3
by Graphing
Vocabulary A-Z
Let us learn some vocabulary y = 2x + 2
system of inequalities y = –x –3
is a set of two or more inequalities with the same
variables.
Note there are 2 boundaries: 5x – y = 3
(for inequality 5x – y > 3) is solid because it
is included ) 2x – 4y = 1 (for inequality Answer
2x – 4y < 1) is dashed because it is not
included. The solution includes the ordered pairs in the
intersection of the graphs of y < 2x + 2 and
y ≥ – x – 3.The region is shaded in green.
The graphs y = 2x + 2 and y = – x – 3 are
boundaries of this region.
• The graph y = 2x + 2 is dashed and is not
included in the graph of y < 2x + 2.
• The graph of y = – x – 3 is solid and is included
in the graph of y ≥ – x – 3.
Solve the system of inequalities by graphing.
y ≥ –3x + 1
y ≤ –3x – 2
Answer
The graphs of y = –3x + 1 and y = –3x – 2 are
parallel lines. Because the two regions have no
points in common, the system of inequalities
has no solution.
31