Page 44 - Math Course 3 (Book 1)
P. 44

Quadratic Equations
           Mo. 2


           Lesson 1                                         Key Concept


          KEY CONCEPTS:                                     Quadratic Function
          1. Graph quadratic functions.
          2. Find the equation of the axis of symmetry      Words     A quadratic function can be
                                                                      described by an equation of the
              and the coordinates of the vertex of a                  form y = ax  + bx + c, where a ≠ 0.
                                                                               2
              parabola.
                                                            Models           y             y


         MO. 2 - L1a                                                       0      x        0      x

                Quadratic Functions:
                         Graphing                                                   y


                     Vocabulary A-Z                                              0       x

                     Let us learn some vocabulary                                y = x 2


         quadratic function                                              Let’s Begin

         A function f is a quadratic function if
                2
         f(x) = ax  + bx + c, where a, b, and c are
         real numbers, with a ≠ 0.
                                                           Graph Opens Upwards

           A quadratic function can be written in the form
                              2
                         y = ax  + bx + c.                  Example

                                                                                          2
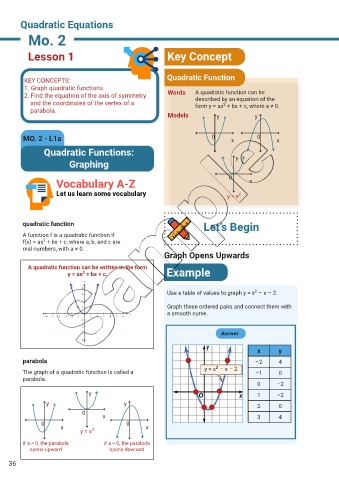
                                                            Use a table of values to graph y = x  – x – 2.
                                                            Graph these ordered pairs and connect them with
                                                            a smooth curve.


                                                                               Answer


                                                                                           x       y
         parabola                                                                          –2      4

         The graph of a quadratic function is called a                   y = x² – x – 2    –1      0
         parabola.
                                                                                           0      –2
                                y                                                          1      –2

                 y                           y                                             2       0
                              0
                                     x                                                     3       4
                0                            0
                      x                             x
                             y = x 2
         if a > 0, the parabola       if a < 0, the parabola
           opens upward                opens downard
    36
   39   40   41   42   43   44   45   46   47   48   49