Page 181 - Math Course 3 (Book 2)
P. 181

Understanding Box-and-Whisker Plots


               Interpret Data
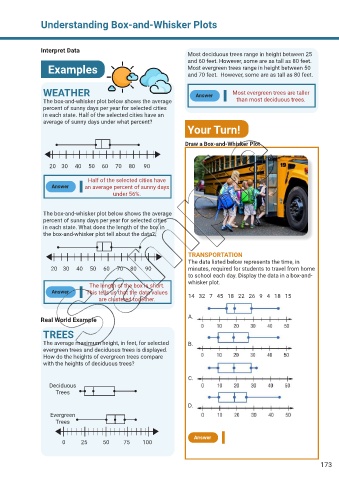
                                                                   Most deciduous trees range in height between 25
                                                                   and 60 feet. However, some are as tall as 80 feet.
                  Examples                                         Most evergreen trees range in height between 50
                                                                   and 70 feet.  However, some are as tall as 80 feet.


                WEATHER                                               Answer       Most evergreen trees are taller
                The box-and-whisker plot below shows the average                    than most deciduous trees.
                percent of sunny days per year for selected cities
                in each state. Half of the selected cities have an
                average of sunny days under what percent?
                                                                   Your Turn!


                                                                  Draw a Box-and-Whisker Plot


                    20    30     40     50     60     70     80      90

                                Half of the selected cities have
                   Answer      an average percent of sunny days
                                         under 56%.


                The box-and-whisker plot below shows the average
                percent of sunny days per year for selected cities
                in each state. What does the length of the box in
                the box-and-whisker plot tell about the data?


                                                                   TRANSPORTATION
                                                                   The data listed below represents the time, in
                    20    30     40     50     60     70     80      90  minutes, required for students to travel from home
                                                                   to school each day. Display the data in a box-and-
                                                                   whisker plot.
                                The length of the box is short.
                   Answer      This tells us that the data values
                                    are clustered together.        14   32   7   45   18   22   26   9   4   18   15


               Real World Example                                  A.


                TREES
                The average maximum height, in feet, for selected   B.
                evergreen trees and deciduous trees is displayed.
                How do the heights of evergreen trees compare
                with the heights of deciduous trees?

                                                                   C.
                  Deciduous
                     Trees

                                                                   D.
                   Evergreen
                     Trees

                                                                     Answer
                        0           25           50          75         100


                                                                                                                  173
   176   177   178   179   180   181   182   183   184   185   186