
Page 184 - Math Course 3 (Book 2)
P. 184
Understanding Stem-and-Leaf Plots
Mo. 12
Lesson 2 stems
The greatest place value of the data is used for the
stems.
KEY CONCEPTS: leaves
1. Display data in stem-and-leaf plots. The next greatest place value forms the leaves.
2. Interpret data in stem-and-leaf plots.
Stem Leaf Stem Leaf
4 2 4 2 8 6 4 2 2 4 6 9
MO. 12 - L2a 5 2 0 5 5 0 2 5
Display Data in 6 1 0 6 0 1
Stem-and-leaf Plots Numbers are split into ‘leaves’ (usually the last
digit) and ‘stems’ (the other digit)
Vocabulary A-Z
Let us learn some vocabulary Let’s Begin
stem-and-leaf plot
In a stem-and-leaf plot, numerical data are listed in Real World Example
ascending or descending order.
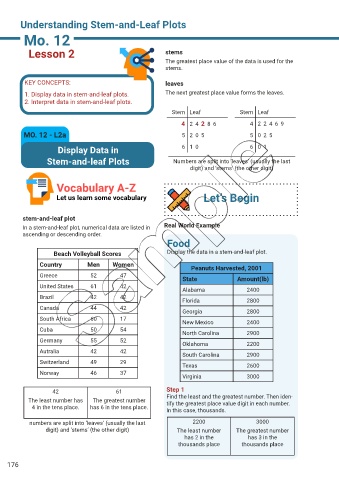
Food
Beach Volleyball Scores Display the data in a stem-and-leaf plot.
Country Men Women Peanuts Harvested, 2001
Greece 52 47
State Amount(lb)
United States 61 42
Alabama 2400
Brazil 42 42
Florida 2800
Canada 44 42
Georgia 2800
South Africa 60 17
New Mexico 2400
Cuba 50 54
North Carolina 2900
Germany 55 52
Oklahoma 2200
Autralia 42 42
South Carolina 2900
Switzerland 49 29
Texas 2600
Norway 46 37
Virginia 3000
42 61 Step 1
The least number has The greatest number Find the least and the greatest number. Then iden-
tify the greatest place value digit in each number.
4 in the tens place. has 6 in the tens place. In this case, thousands.
numbers are split into ‘leaves’ (usually the last 2200 3000
digit) and ‘stems’ (the other digit) The least number The greatest number
has 2 in the has 3 in the
thousands place thousands place
176