
Page 182 - Math Course 3 (Book 2)
P. 182
Understanding Box-and-Whisker Plots
Interpret Data Real World Example
RETAIL CARS
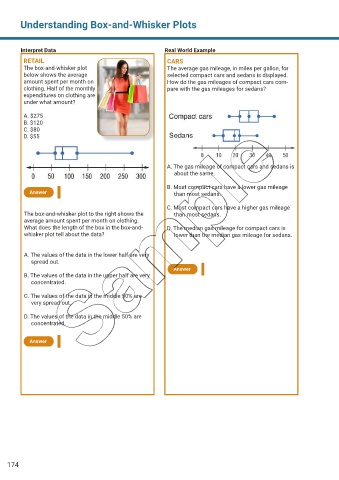
The box-and-whisker plot The average gas mileage, in miles per gallon, for
below shows the average selected compact cars and sedans is displayed.
amount spent per month on How do the gas mileages of compact cars com-
clothing. Half of the monthly pare with the gas mileages for sedans?
expenditures on clothing are
under what amount?
A. $275
B. $120
C. $80
D. $55
A. The gas mileage of compact cars and sedans is
about the same.
B. Most compact cars have a lower gas mileage
Answer than most sedans.
C. Most compact cars have a higher gas mileage
The box-and-whisker plot to the right shows the than most sedans.
average amount spent per month on clothing.
What does the length of the box in the box-and- D. The median gas mileage for compact cars is
whisker plot tell about the data? lower than the median gas mileage for sedans.
A. The values of the data in the lower half are very
spread out.
Answer
B. The values of the data in the upper half are very
concentrated.
C. The values of the data in the middle 50% are
very spread out.
D. The values of the data in the middle 50% are
concentrated.
Answer
174