
Page 122 - Math Course 1 (Book 1)
P. 122
Algebra: Scatter Plots
B. STUDY SKILLS The table shows hours spent C. STUDY SKILLS The table shows hours spent
studying for a test and the corresponding test studying for a test and the corresponding test
score. Does the scatter plot show a relationship score. Predict the test score for a student who
between hours studied and a student’s test score? spends 7 hours studying.
A. Yes, a positive relationship exists. A. between 65 and 70
B. Yes, a negative relationship exists. B. between 75 and 80
C. No, no relationship exists. C. between 95 and 100
D. none of the above D. between 105 and 110
Answer Answer
Skill Practice!
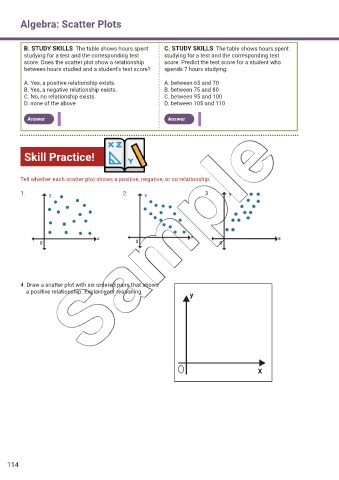
Tell whether each scatter plot shows a positive, negative, or no relationship.
1. 2. 3.
4. Draw a scatter plot with six ordered pairs that shows
a positive relationship. Explain your reasoning.
y
X
114