
Page 118 - Math Course 1 (Book 1)
P. 118
Algebra: Scatter Plots
Mo. 3
Lesson 6
KEY CONCEPTS:
1. Construct scatter plots.
2. Analyze trends in scatter plots.
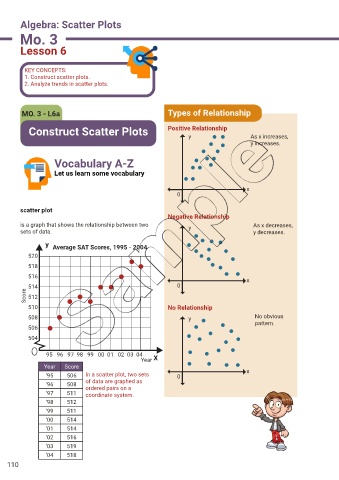
MO. 3 - L6a Types of Relationship
Construct Scatter Plots Positive Relationship
y As x increases,
y increases.
Vocabulary A-Z
Let us learn some vocabulary
x
0
scatter plot
Negative Relationship
is a graph that shows the relationship between two y As x decreases,
sets of data. y decreases.
y Average SAT Scores, 1995 - 2004
520
518
516
x
514 0
Score 512
510 No Relationship
508 y No obvious
pattern.
506
504
95 96 97 98 99 00 01 02 03 04
Year X
Year Score x
‘95 506 In a scatter plot, two sets 0
of data are graphed as
‘96 508
ordered pairs on a
‘97 511 coordinate system.
‘98 512
‘99 511
‘00 514
‘01 514
‘02 516
‘03 519
‘04 518
110