
Page 121 - Math Course 1 (Book 1)
P. 121
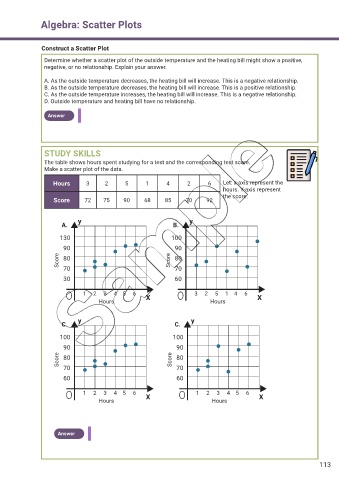
Algebra: Scatter Plots


                Construct a Scatter Plot
                 Determine whether a scatter plot of the outside temperature and the heating bill might show a positive,
                 negative, or no relationship. Explain your answer.

                 A. As the outside temperature decreases, the heating bill will increase. This is a negative relationship.
                 B. As the outside temperature decreases, the heating bill will increase. This is a positive relationship.
                 C. As the outside temperature increases, the heating bill will increase. This is a negative relationship.
                 D. Outside temperature and heating bill have no relationship.

                  Answer


                 STUDY SKILLS

                 The table shows hours spent studying for a test and the corresponding test score.
                 Make a scatter plot of the data.

                    Hours      3      2      5      1       4      2      6    Let: x-axis represent the
                                                                               hours. Y-axis represent
                                                                               the score.
                    Score      72    75     90      68     85     70      92


                            y                                       y
                       A.                                     B.
                      130                                    100

                       90                                     90
                      Score  80                              Score  80
                       70                                     70
                       30                                     60


                               1     2     3     4    5     6         3     2     5     1    4     6
                                    Hours           X                      Hours           X


                            y                                       y
                       C.                                     C.

                      100                                     100
                       90                                      90
                      Score  80                              Score  80

                       70                                      70
                       60                                      60

                               1     2     3     4    5     6          1     2     3     4    5     6
                                    Hours           X                      Hours            X


                     Answer


                                                                                                                 113