Page 150 - Math Course 1 (Book 2)
P. 150

Measures of Variation

          Mo. 11

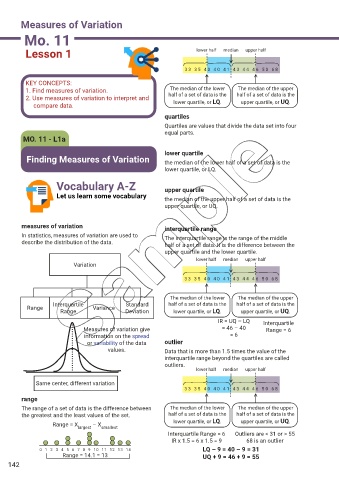
          Lesson 1                                                    lower half  median  upper half


                                                                  33  35  40  40  4 1 4 3 4 4 4 6 5 0  68
          KEY CONCEPTS:
          1. Find measures of variation.                     The median of the lower   The median of the upper
          2. Use measures of variation to interpret and     half of a set of data is the   half of a set of data is the
               compare data.                                  lower quartile, or LQ.  upper quartile, or UQ.

                                                           quartiles
                                                           Quartiles are values that divide the data set into four
                                                           equal parts.
         MO. 11 - L1a

                                                           lower quartile
          Finding Measures of Variation                    the median of the lower half of a set of data is the
                                                           lower quartile, or LQ.

                     Vocabulary A-Z                        upper quartile

                     Let us learn some vocabulary          the median of the upper half of a set of data is the
                                                           upper quartile, or UQ.


         measures of variation                             interquartile range
         In statistics, measures of variation are used to   The interquartile range is the range of the middle
         describe the distribution of the data.
                                                           half of a set of data. It is the difference between the
                                                           upper quartile and the lower quartile.
                                                                      lower half  median  upper half
                           Variation

                                                                  33  35  40  40  4 1 4 3 4 4 4 6 5 0  68


                                                             The median of the lower   The median of the upper
                    Interquartile            Standard       half of a set of data is the   half of a set of data is the
           Range                  Variance
                      Range                  Deviation        lower quartile, or LQ.  upper quartile, or UQ.
                                                                              IR = UQ – LQ   Interquartile
                              Measures of variation give                       = 46 – 40      Range = 6
                               information on the spread                          = 6
                                or variability of the data   outlier
                                       values.             Data that is more than 1.5 times the value of the
                                                           interquartile range beyond the quartiles are called
                                                           outliers.
                                                                      lower half  median  upper half

              Same center, different variation
                                                                  33  35  40  40  4 1 4 3 4 4 4 6 5 0  68
         range
         The range of a set of data is the difference between   The median of the lower   The median of the upper
         the greatest and the least values of the set.      half of a set of data is the   half of a set of data is the
                   Range = X      – X                         lower quartile, or LQ.  upper quartile, or UQ.
                            largest  smallest
                                                            Interquartile Range = 6  Outliers are < 31 or > 55
                                                             IR x 1.5 = 6 x 1.5 = 9     68 is an outlier
               0  1  2  3  4  5  6  7  8  9  10  11  12  13  14         LQ – 9 = 40 – 9 = 31
                       Range = 14.1 = 13                                UQ + 9 = 46 + 9 = 55
    142
   145   146   147   148   149   150   151   152   153   154   155