
Page 152 - Math Course 1 (Book 2)
P. 152
Measures of Variation
B. Find the range of the set of data. MO. 11 - L1b
A. 27 Stem Leaf Measures of Variation:
B. 20 5 2 3 5 5 9
C. 18 6 4 8 9 Interpreting Data
D. 12
7 0 1 8 9
6|8 = 68 Key Concept
Answer Interquartile Range
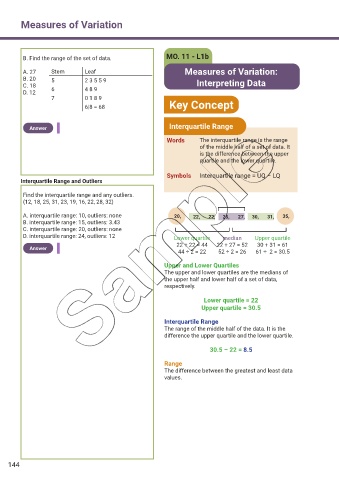
Words The interquartile range is the range
of the middle half of a set of data. It
is the difference between the upper
quartile and the lower quartile.
Symbols Interquartile range = UQ – LQ
Interquartile Range and Outliers
Find the interquartile range and any outliers.
{12, 18, 25, 31, 23, 19, 16, 22, 28, 32}
A. interquartile range: 10, outliers: none 20, 22, 22, 25, 27, 30, 31, 35,
B. interquartile range: 15, outliers: 3.43
C. interquartile range: 20, outliers: none
D. interquartile range: 24, outliers: 12 Lower quartile median Upper quartile
22 + 22 = 44 22 + 27 = 52 30 + 31 = 61
Answer
44 ÷ 2 = 22 52 ÷ 2 = 26 61 ÷ 2 = 30.5
Upper and Lower Quartiles
The upper and lower quartiles are the medians of
the upper half and lower half of a set of data,
respectively.
Lower quartile = 22
Upper quartile = 30.5
Interquartile Range
The range of the middle half of the data. It is the
difference the upper quartile and the lower quartile.
30.5 – 22 = 8.5
Range
The difference between the greatest and least data
values.
144