
Page 151 - Math Course 1 (Book 2)
P. 151
Measures of Variation
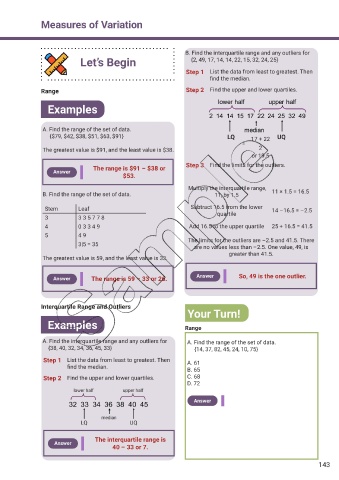
B. Find the interquartile range and any outliers for
Let’s Begin {2, 49, 17, 14, 14, 22, 15, 32, 24, 25}
Step 1 List the data from least to greatest. Then
f nd the median.
Range Step 2 Find the upper and lower quartiles.
lower half upper half
Examples
2 14 14 15 17 22 24 25 32 49
A. Find the range of the set of data. median
{$79, $42, $38, $51, $63, $91} LQ 17 + 22 UQ
=
The greatest value is $91, and the least value is $38. 2
or 19.5
Step 3 Find the limits for the outliers.
The range is $91 – $38 or
Answer
$53.
Multiply the interquartile range,
B. Find the range of the set of data. 11, by 1.5 11 × 1.5 = 16.5
Stem Leaf Subtract 16.5 from the lower 14 –16.5 = –2.5
quartile
3 3 3 5 7 7 8
4 0 3 3 4 9 Add 16.5 to the upper quartile 25 + 16.5 = 41.5
5 4 9
3|5 = 35 The limits for the outliers are –2.5 and 41.5. There
are no values less than –2.5. One value, 49, is
greater than 41.5.
The greatest value is 59, and the least value is 33.
Answer So, 49 is the one outlier.
Answer The range is 59 – 33 or 26.
Interquartile Range and Outliers
Your Turn!
Examples Range
A. Find the interquartile range and any outliers for A. Find the range of the set of data.
{38, 40, 32, 34, 36, 45, 33} {14, 37, 82, 45, 24, 10, 75}
Step 1 List the data from least to greatest. Then A. 61
f nd the median. B. 65
Step 2 Find the upper and lower quartiles. C. 68
D. 72
lower half lower half
lower half
upper half
32 33 34 36 38 40 45 Answer
median
median
LQ UQ
The interquartile range is
Answer
40 – 33 or 7.
143