Page 155 - Math Course 1 (Book 2)
P. 155

Understanding Histograms

                 Mo. 11

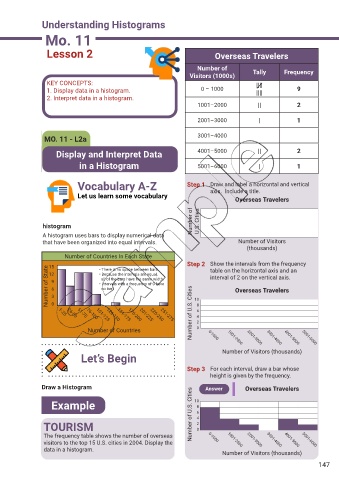
                 Lesson 2                                                   Overseas Travelers


                                                                      Number of           Tally      Frequency
                                                                    Visitors (1000s)
                 KEY CONCEPTS:                                                             ||||
                 1. Display data in a histogram.                        0 – 1000           ||||          9
                 2. Interpret data in a histogram.
                                                                      1001–2000             ||           2


                                                                      2001–3000             |            1


                 MO. 11 - L2a                                         3001–4000

                     Display and Interpret Data                       4001–5000             ||           2
                             in a Histogram                           5001–6000             |            1


                            Vocabulary A-Z                         Step 1 Draw and label a horizontal and vertical

                            Let us learn some vocabulary                   axis.  Include a title.
                                                                                    Overseas Travelers
                                                                    Number of   U.S. Cities


                histogram
                A histogram uses bars to display numerical data
                that have been organized into equal intervals.                       Number of Visitors
                                                                                        (thousands)
                        Number of Countries In Each State
                                                                   Step 2 Show the intervals from the frequency
                  15
                  Number of State  9 6 3 0    all of the bars have the same width.  10 8  interval of 2 on the vertical axis.
                                    • There is no space between bars
                                                                           table on the horizontal axis and an
                  12
                                    • Because the intervals are equal,
                                    • Intervals with a frequency of 0 have
                                      no bar.
                                                                                    Overseas Travelers

                      1-25
                            51-75
                         26-50
                               76-100
                                                      226-250
                                   101-125
                                          151-175
                                      126-150
                                              176-200
                                Number of Countries  201-225  251-275  Number of U.S. Cities  6 4 2 0  0-1000  1001-2000  2001-3000  3001-4000  4001-5000  5001-6000
                                                                               Number of Visitors (thousands)
                             Let’s Begin
                                                                   Step 3 For each interval, draw a bar whose
                                                                           height is given by the frequency.
                Draw a Histogram                                         Answer        Overseas Travelers

                   Example                                          Number of U.S. Cities  10 8 6


                TOURISM                                               4 2 0
                The frequency table shows the number of overseas          0-1000
                visitors to the top 15 U.S. cities in 2004. Display the          1001-2000  2001-3000  3001-4000  4001-5000  5001-6000
                data in a histogram.
                                                                               Number of Visitors (thousands)
                                                                                                                 147
   150   151   152   153   154   155   156   157   158   159   160