Page 162 - Math Course 1 (Book 2)
P. 162

Misleading Graphs

          Mo. 11

          Lesson 4                                                    Price of Lemons Graph B


                                                                         1.60
                                                                         1.40
          KEY CONCEPTS:                                                  1.20
          1. Recognize when graphs are misleading.                       1.00
          2. Evaluate predictions and conclusions                      Dollars per pound  0.80
              based on data analysis.                                    0.60
                                                                         0.40
                                                                         0.20
         MO. 11 - L4a                                                    0.00
                                                                            ‘98     ‘00       ‘02      ‘04
                                                                                   Year
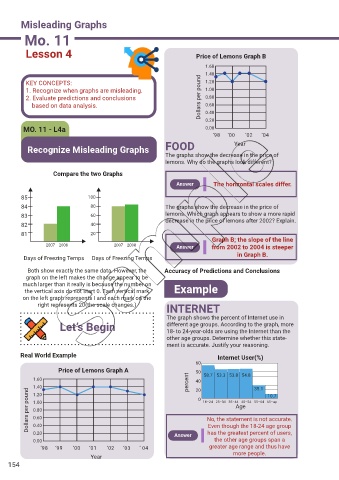
           Recognize Misleading Graphs                     FOOD
                                                           The graphs show the decrease in the price of
                                                           lemons. Why do the graphs look different?
                    Compare the two Graphs

                                                               Answer       The horizontal scales differ.

        85                      100
        84                       80                        The graphs show the decrease in the price of
        83                       60                        lemons. Which graph appears to show a more rapid
                                                           decrease in the price of lemons after 2002? Explain.
        82                       40
        81                       20
                                                                           Graph B; the slope of the line
                 2007  2008              2007  2008            Answer      from 2002 to 2004 is steeper
                                                                                    in Graph B.
         Days of Freezing Temps  Days of Freezing Temps

           Both show exactly the same data. However, the   Accuracy of Predictions and Conclusions
          graph on the left makes the change appear to be
         much larger than it really is because the number on
          the vertical axis do not start 0. Each vertical mark   Example
         on the left graph represents I and each mark on the
              right represents 20(the scale changes.)
                                                            INTERNET
                                                            The graph shows the percent of Internet use in
                      Let’s Begin                           different age groups. According to the graph, more
                                                            18- to 24-year-olds are using the Internet than the
                                                            other age groups. Determine whether this state-
                                                            ment is accurate. Justify your reasoning.
        Real World Example                                                   Internet User(%)
                                                                      60
                      Price of Lemons Graph A                         50
             1.60                                                  percent  40  58.7 53.3 53.8 54.8
             1.40                                                     20                  35.1  10.7
           Dollars per pound  1.00                                     0  18–24 25–34 35–44  45–54 55–64 65–up
             1.20
                                                                                    Age
             0.80
             0.60
                                                                          No, the statement is not accurate.
                                                                          Even though the 18-24 age group
             0.40
             0.20                                             Answer      has the greatest percent of users,
             0.00                                                           the other age groups span a
               ‘98     ‘99       ‘00      ‘01       ‘02      ‘03      ‘ 04  greater age range and thus have
                                                                                   more people.
                                 Year
    154
   157   158   159   160   161   162   163   164   165   166   167