Page 160 - Math Course 1 (Book 2)
P. 160

Data Graph


        Select an Appropriate Display
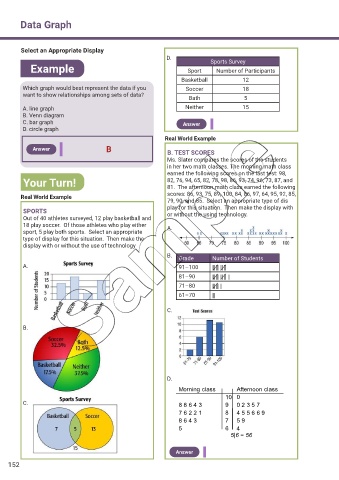
                                                            D.             Sports Survey
            Example                                                Sport     Number of Participants

                                                                 Basketball           12
         Which graph would best represent the data if you         Soccer              18
         want to show relationships among sets of data?
                                                                   Bath                5
         A. line graph                                            Neither             15
         B. Venn diagram
         C. bar graph                                            Answer
         D. circle graph
                                                           Real World Example
             Answer                   B                     B. TEST SCORES
                                                            Ms. Slater compares the scores of the students
                                                            in her two math classes. The morning math class
                                                            earned the following scores on the last test: 98,
         Your Turn!                                         82, 76, 94, 65, 82, 78, 98, 86, 93, 74, 96, 73, 87, and
                                                            81.  The afternoon math class earned the following
                                                            scores: 86, 93, 75, 89, 100, 84, 86, 97, 64, 95, 92, 85,
        Real World Example
                                                            79, 90, and 85.  Select an appropriate type of dis
                                                            play for this situation.  Then make the display with
          SPORTS                                            or without the using technology.
          Out of 40 athletes surveyed, 12 play basketball and
          18 play soccer.  Of those athletes who play either     A.
          sport, 5 play both sports.  Select an appropriate
          type of display for this situation.  Then make the
          display with or without the use of technology
                                                            B.
                                                                Grade       Number of Students
          A.                                                    91–100      |||| ||||
                                                                81–90       |||| |||| |
                                                                71–80       |||| |

                                                                61–70       ||

                                                            C.


          B.


                                                            D.

                                                                Morning class       Afternoon class
                                                                                10  0
          C.                                                    8 8 6 4 3       9   0 2 3 5 7
                                                                7 6 2 2 1       8   4 5 5 6 6 9
                                                                8 6 4 3         7   5 9
                                                                5               6   4
                                                                                  5|6 = 56

                                                               Answer

    152
   155   156   157   158   159   160   161   162   163   164   165