
Page 157 - Math Course 1 (Book 2)
P. 157
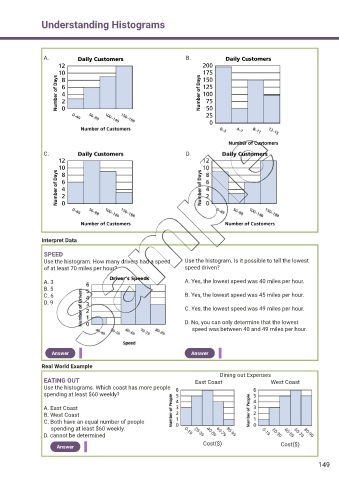
Understanding Histograms


                 A.                                               B.


                 C.                                               D.


                Interpret Data

                 SPEED
                 Use the histogram. How many drivers had a speed    Use the histogram. Is it possible to tell the lowest
                 of at least 70 miles per hour?                   speed driven?

                 A. 3                                             A. Yes, the lowest speed was 40 miles per hour.
                 B. 5
                 C. 6                                             B. Yes, the lowest speed was 45 miles per hour.
                 D. 9
                                                                  C. Yes, the lowest speed was 49 miles per hour.

                                                                  D. No, you can only determine that the lowest
                                                                       speed was between 40 and 49 miles per hour.


                   Answer                                           Answer

                Real World Example
                                                                              Dining out Expenses
                 EATING OUT                                           East Coast                West Coast
                 Use the histograms. Which coast has more people
                 spending at least $60 weekly?

                 A. East Coast
                 B. West Coast
                 C. Both have an equal number of people
                      spending at least $60 weekly.               0-19                       0-19
                 D. cannot be determined                             20-39  40-59 60-79 80-99   20-39  40-59 60-79 80-99
                                                                        Cost($)                     Cost($)
                     Answer


                                                                                                                 149