
Page 156 - Math Course 1 (Book 2)
P. 156
Understanding Histograms
Interpret Data Real World Example
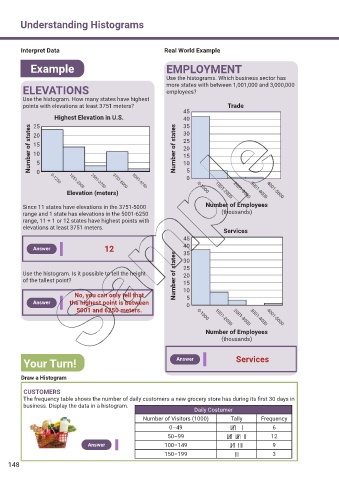
Example EMPLOYMENT
Use the histograms. Which business sector has
more states with between 1,001,000 and 3,000,000
ELEVATIONS employees?
Use the histogram. How many states have highest
points with elevations at least 3751 meters? Trade
45
Highest Elevation in U.S. 40
35
25
Number of states 20 Number of states 30
25
15
20
10
15
5
10
5
0
0
0-1250
3751-5000
5001-6250
1251-2500
2501-3750
Elevation (meters) 0-1000 1001-2000 2001-3000 3001-4000 4001-5000
Since 11 states have elevations in the 3751-5000 Number of Employees
range and 1 state has elevations in the 5001-6250 (thousands)
range, 11 + 1 or 12 states have highest points with
elevations at least 3751 meters.
Services
45
Answer 12 40
35
Number of states 20
30
Use the histogram. Is it possible to tell the height 25
of the tallest point? 15
No, you can only tell that 10
5
Answer the highest point is between 0
5001 and 6250 meters. 0-1000 1001-2000 2001-3000 3001-4000 4001-5000
Number of Employees
(thousands)
Your Turn! Answer Services
Draw a Histogram
CUSTOMERS
The frequency table shows the number of daily customers a new grocery store has during its f rst 30 days in
business. Display the data in a histogram.
Daily Costumer
Number of Visitors (1000) Tally Frequency
0–49 |||| | 6
50–99 |||| |||| || 12
Answer 100–149 |||| |||| 9
150–199 ||| 3
148