Page 217 - Math Course 3 (Book 2)
P. 217

Probability Distributions


                Your Turn!


               Random Variable
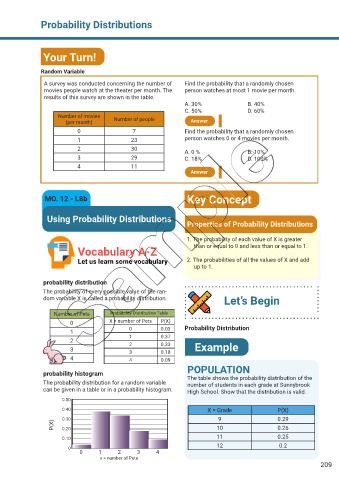
                A survey was conducted concerning the number of   Find the probability that a randomly chosen
                movies people watch at the theater per month. The   person watches at most 1 movie per month.
                results of this survey are shown in the table.
                                                                  A. 30%                B. 40%
                                                                  C. 50%                D. 60%
                     Number of movies    Number of people
                        (per month)                                 Answer
                            0                   7                 Find the probability that a randomly chosen
                            1                  23                 person watches 0 or 4 movies per month.
                            2                  30                 A. 0 %                B. 10%
                            3                  29                 C. 18%                D. 100%
                            4                  11
                                                                    Answer


                 MO. 12 - L8b                                      Key Concept


                  Using Probability Distributions
                                                                   Properties of Probability Distributions


                                                                   1. The probability of each value of X is greater
                            Vocabulary A-Z                              than or equal to 0 and less than or equal to 1.

                            Let us learn some vocabulary           2. The probabilities of all the values of X and add
                                                                        up to 1.

                probability distribution
                The probability of every possible value of the ran-
                dom variable X is called a probability distribution.            Let’s Begin


                    Number of Pets      Probability Distribution Table
                          0            X = number of Pets  P(X)
                          1                   0           0.03    Probability Distribution
                                              1
                                                          0.37
                          2                   2           0.33
                          3                   3           0.18       Example
                          4                   4           0.09

                probability histogram                              POPULATION
                                                                   The table shows the probability distribution of the
                The probability distribution for a random variable   number of students in each grade at Sunnybrook
                can be given in a table or in a probability histogram.  High School. Show that the distribution is valid.

                       0.50
                       0.40                                               X = Grade               P(X)
                       0.30                                                   9                   0.29
                    P(X)  0.20                                               10                   0.26

                       0.10                                                  11                   0.25
                                                                             12                    0.2
                         0
                             0      1     2      3      4
                                    x = number of Pets
                                                                                                                  209
   212   213   214   215   216   217   218   219   220   221   222