
Page 218 - Math Course 3 (Book 2)
P. 218
Probability Distributions
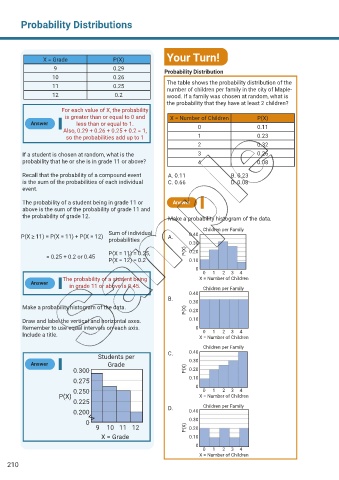
X = Grade P(X) Your Turn!
9 0.29 Probability Distribution
10 0.26
11 0.25 The table shows the probability distribution of the
number of children per family in the city of Maple-
12 0.2 wood. If a family was chosen at random, what is
the probability that they have at least 2 children?
For each value of X, the probability
is greater than or equal to 0 and X = Number of Children P(X)
Answer less than or equal to 1. 0 0.11
Also, 0.29 + 0.26 + 0.25 + 0.2 = 1,
so the probabilities add up to 1 1 0.23
2 0.32
If a student is chosen at random, what is the 3 0.26
probability that he or she is in grade 11 or above? 4 0.08
Recall that the probability of a compound event A. 0.11 B. 0.23
is the sum of the probabilities of each individual C. 0.66 D. 0.08
event.
The probability of a student being in grade 11 or Answer
above is the sum of the probability of grade 11 and
the probability of grade 12. Make a probability histogram of the data.
Children per Family
Sum of individual 0.40
P(X ≥ 11) = P(X = 11) + P(X = 12) A.
probabilities
0.30
P(X = 11) = 0.25, P(X) 0.20
= 0.25 + 0.2 or 0.45
P(X = 12) = 0.2 0.10
0
0 1 2 3 4
The probability of a student being X = Number of Children
Answer
in grade 11 or above is 0.45. Children per Family
0.40
B. 0.30
Make a probability histogram of the data.
P(X) 0.20
Draw and label the vertical and horizontal axes. 0.10
Remember to use equal intervals on each axis. 0 0 1 2 3 4
Include a title. X = Number of Children
Children per Family
0.40
Students per C.
Answer Grade 0.30
0.300 P(X) 0.20
0.275 0.10
0
0.250 0 1 2 3 4
P(X) X = Number of Children
0.225
D. Children per Family
0.200 0.40
0 0.30
9 10 11 12 P(X) 0.20
X = Grade 0.10
0
0 1 2 3 4
X = Number of Children
210